Projects

Theses, personal projects and course projects. Each page describes the problem, the approach and the results.

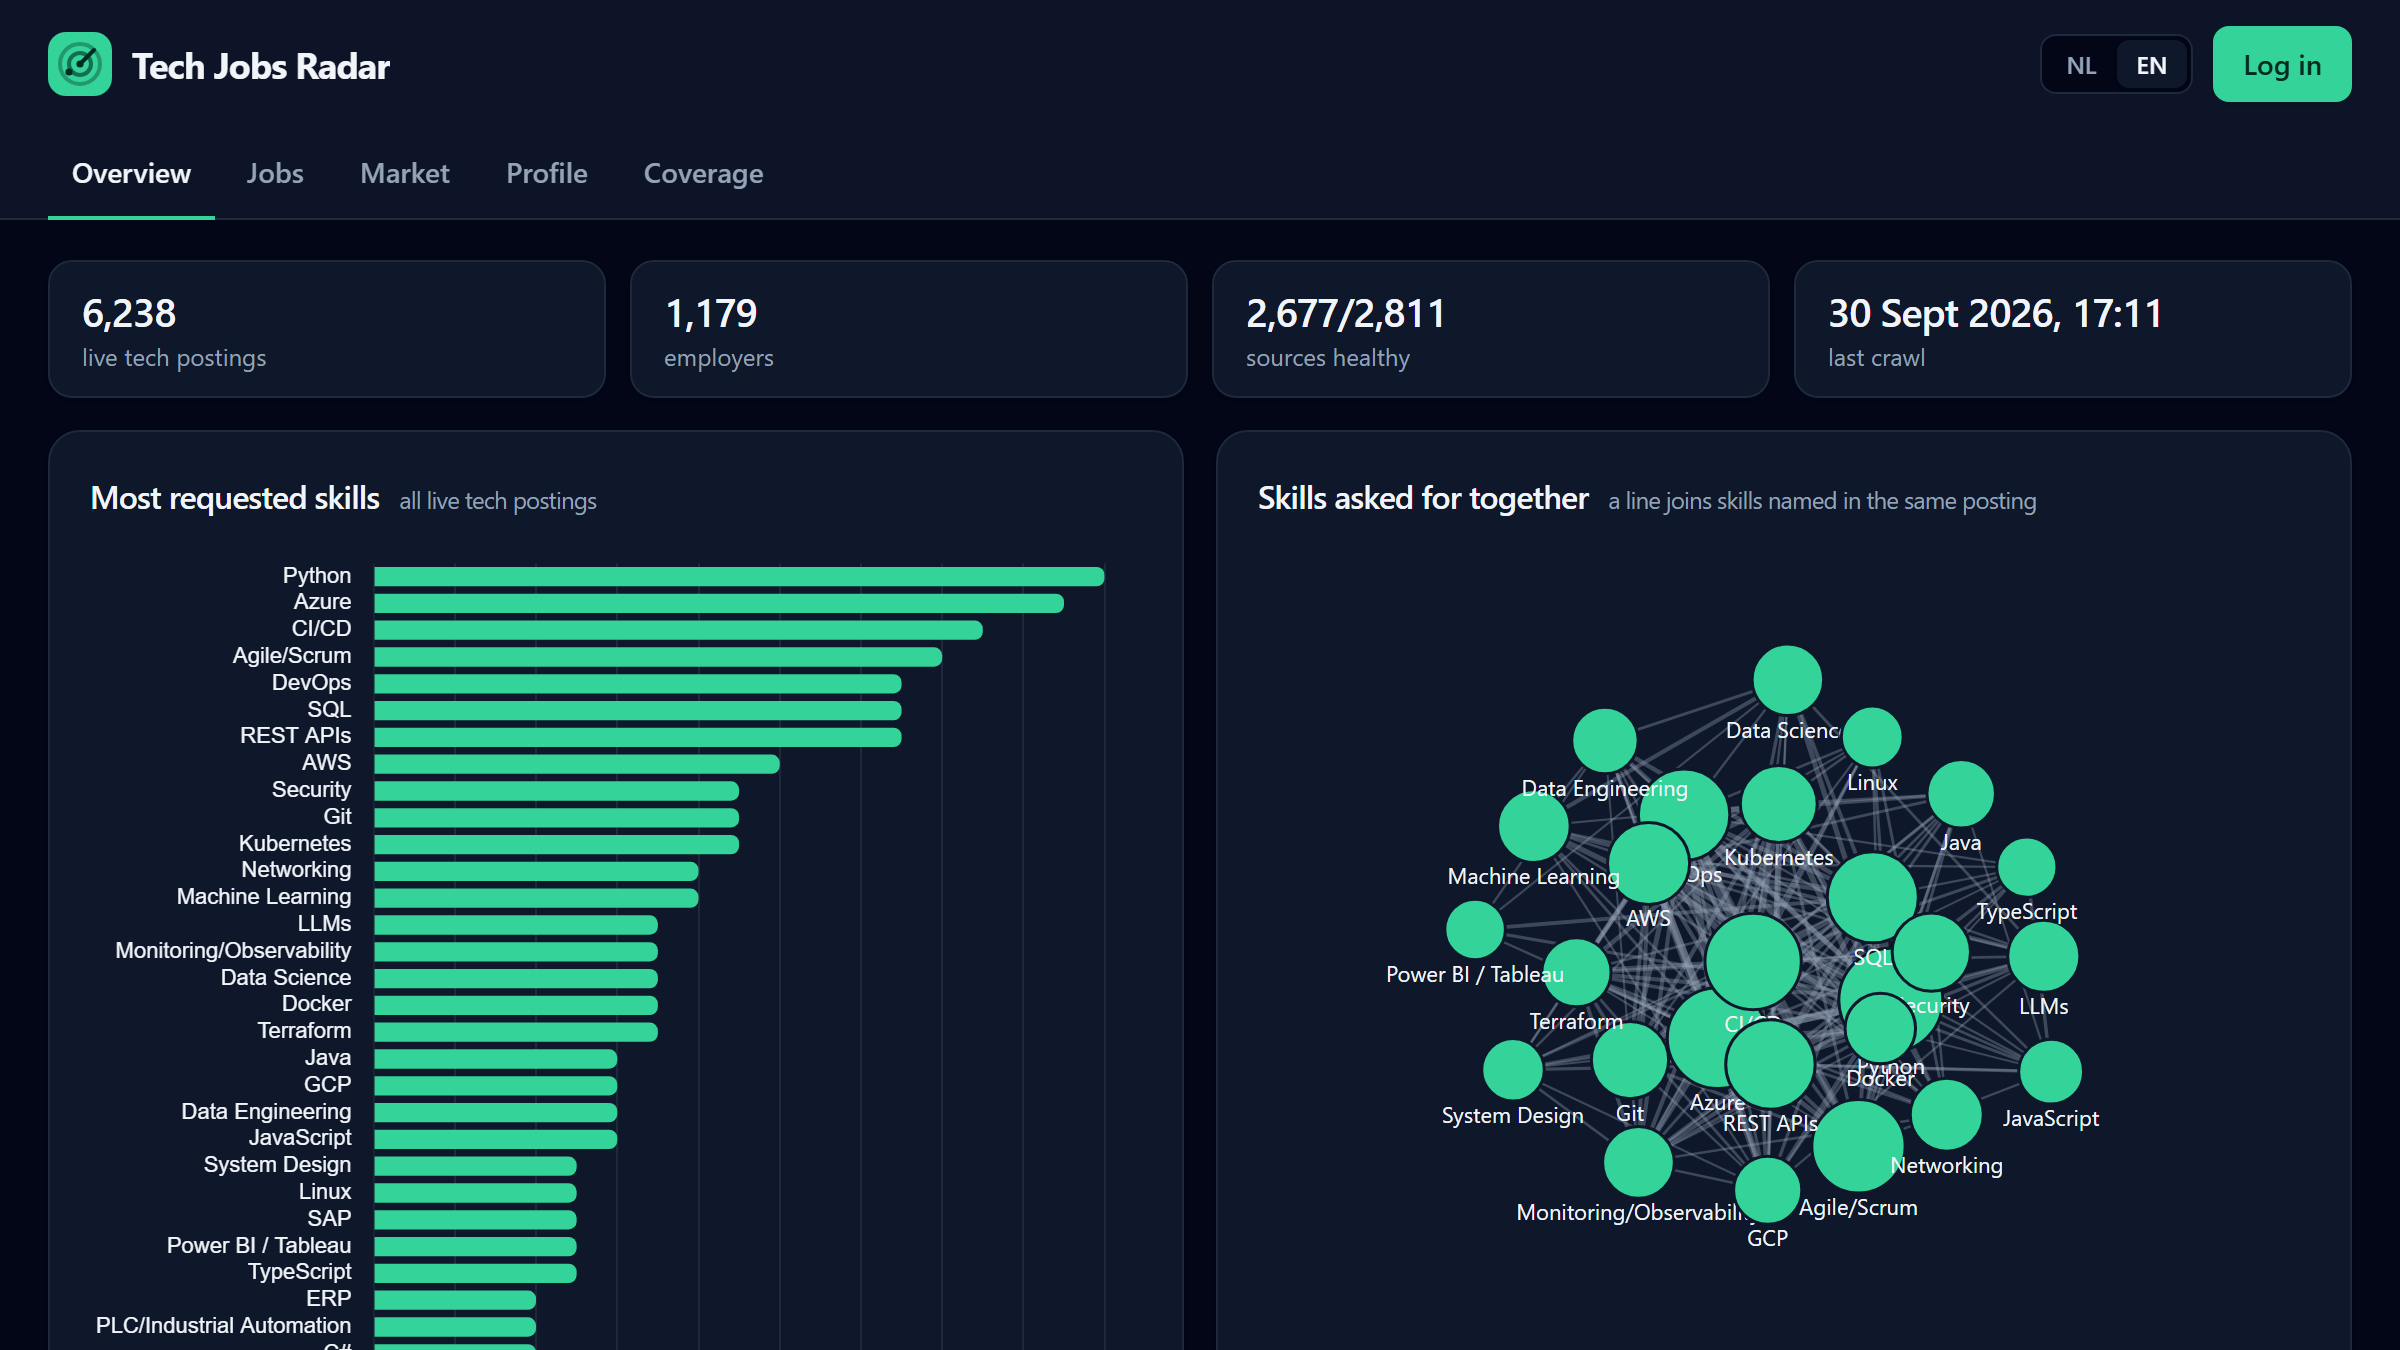
Tech Jobs Radar overview page with skill demand charts
Live since September 2026

Tech Jobs Radar

A public job board that reads postings from Dutch employer career sites, classifies tech roles and extracts fields such as skills, seniority and visa sponsorship. I designed the system and maintain it in production, with an evaluation gate in CI and a Kubernetes deployment on AWS.
  • FastAPI
  • Postgres
  • Kubernetes
  • AWS
  • Terraform
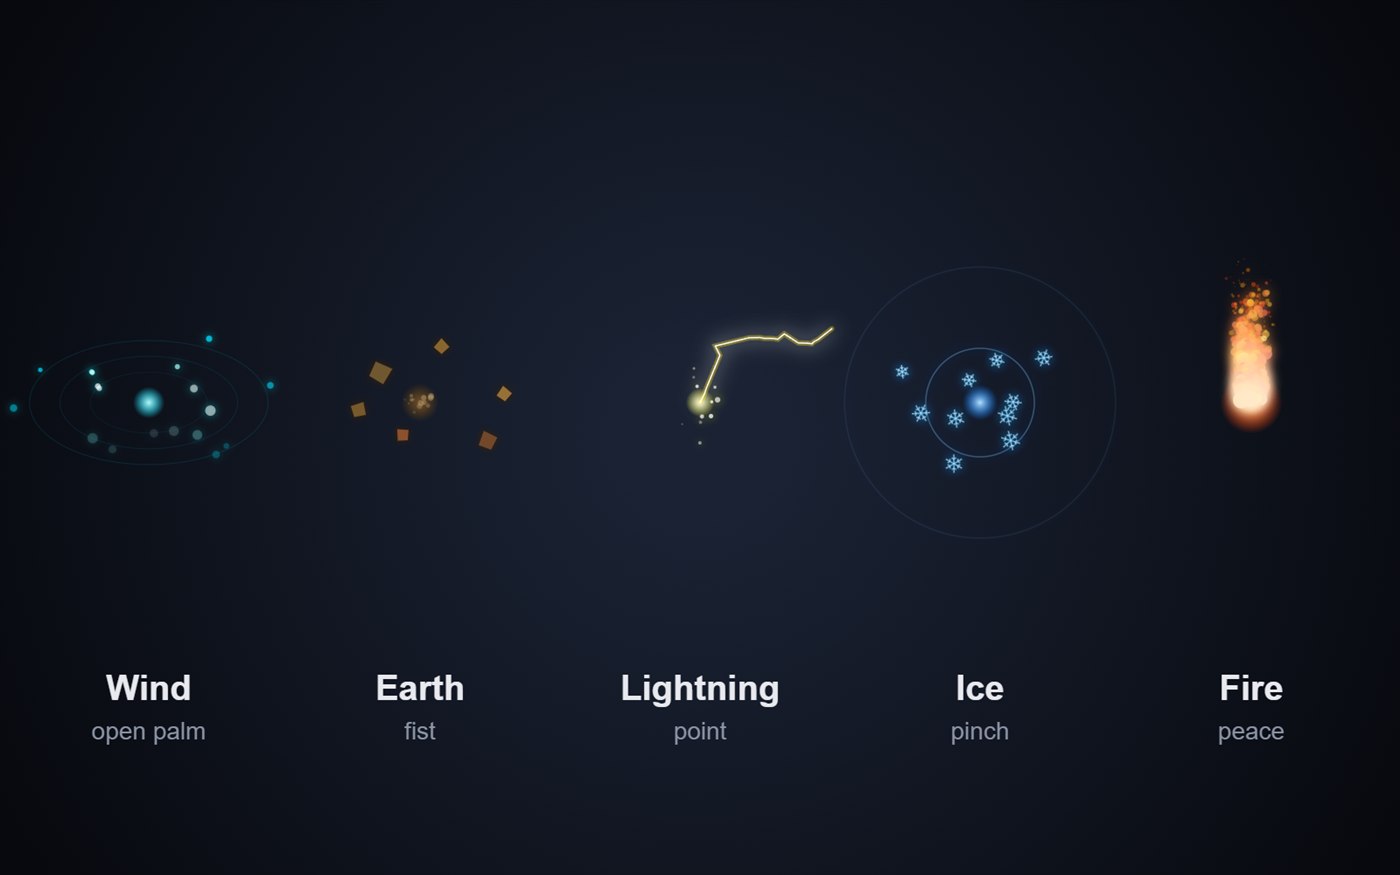
The five effects drawn by the demo: wind, earth, lightning, ice and fire, with the gesture for each
Personal project

AR gestures

A browser demo that tracks the hand with MediaPipe and renders a particle effect for each of five gestures. I implemented the gesture recognition and the effects, which run in real time in plain JavaScript.

  • JavaScript
  • MediaPipe
  • Canvas 2D
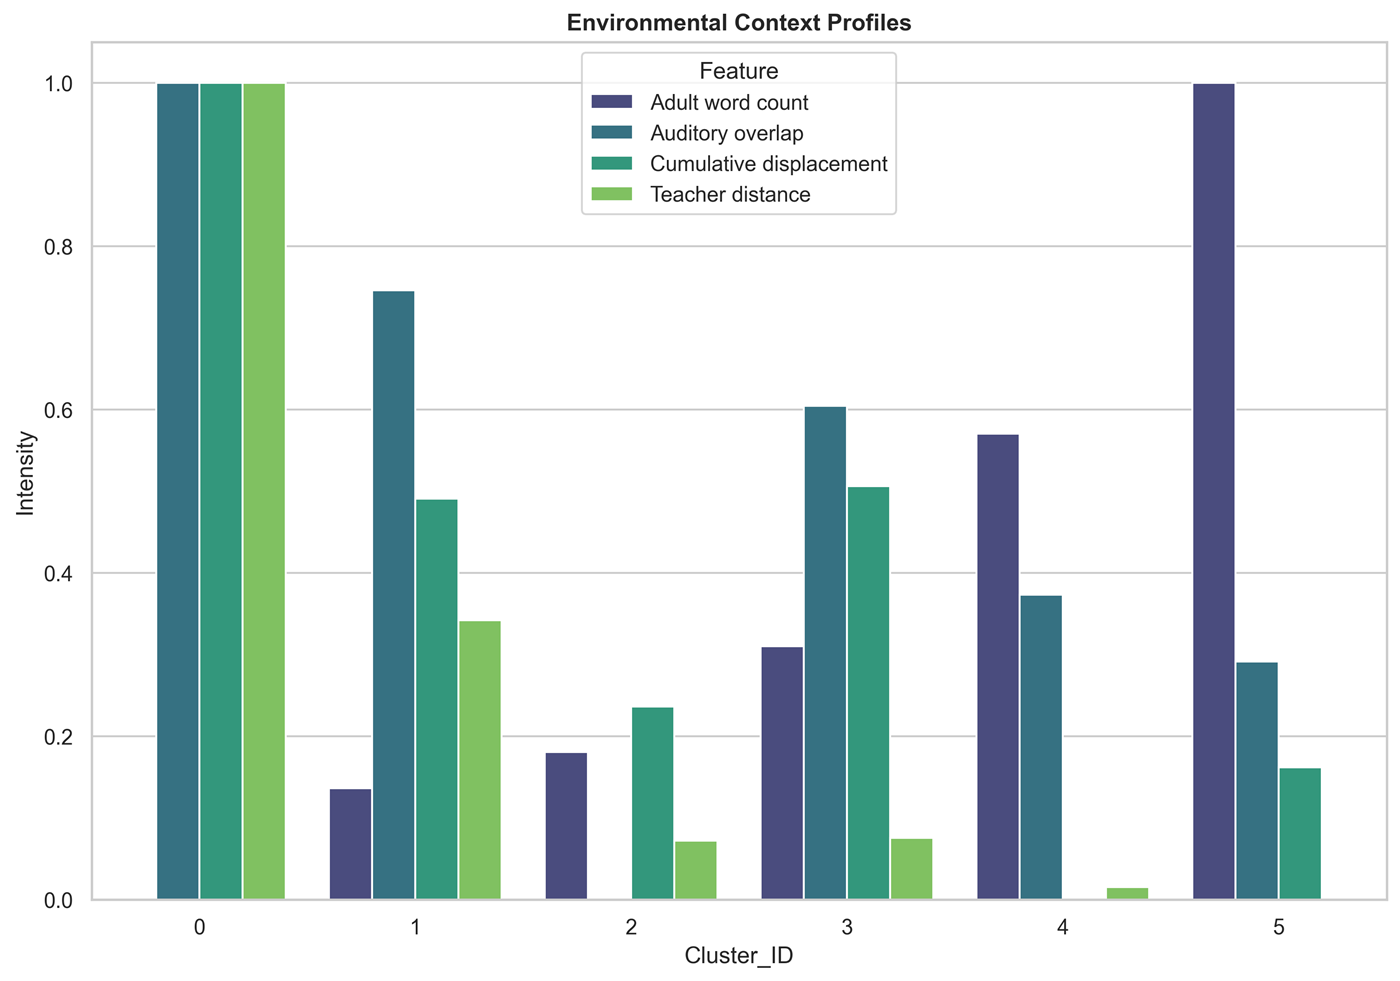
Bar chart of the four sensor features for each of the six activity contexts
MSc thesis · TU Delft

Social inclusion from sensor data

Measures the social inclusion of preschool children with hearing loss from wearable positioning and audio data. I fused the sensor streams, identified six activity contexts with a Gaussian Mixture Model and compared the two groups of children within each context using mixed-effects models.

  • Unsupervised learning
  • Mixed models
  • Multimodal data
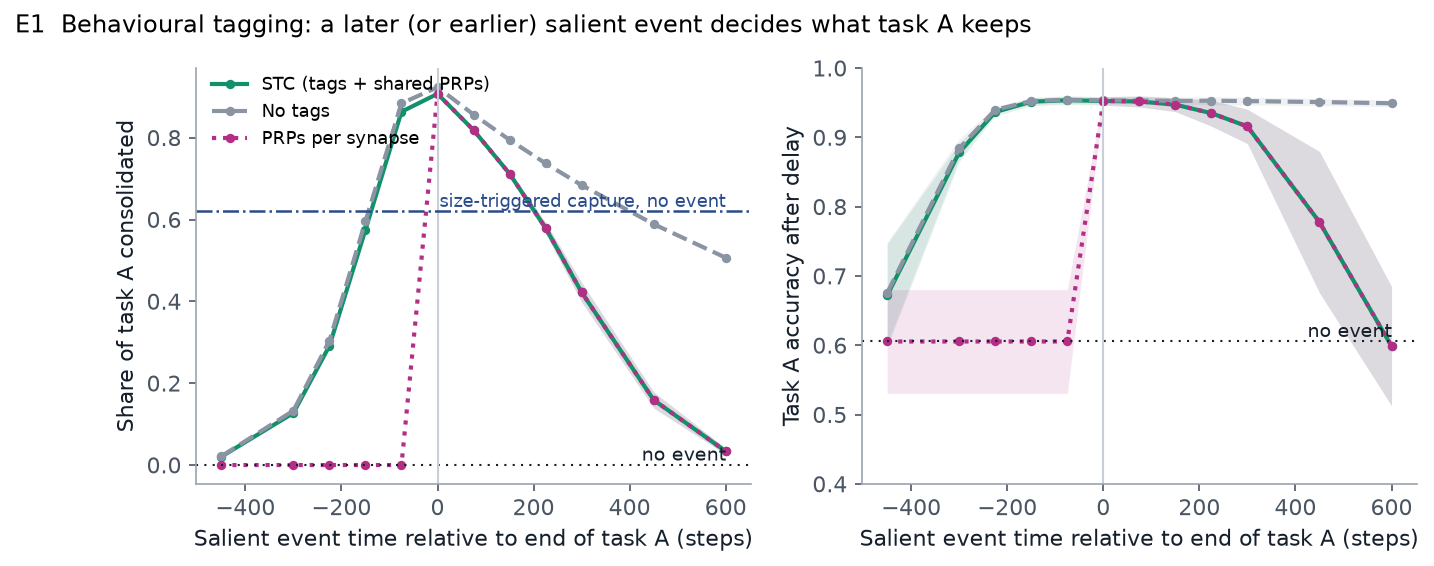
Plot of consolidation against the timing of a salient event
Research · open source

RetroSTC-Net

Applies synaptic tagging and capture, a theory of how memories become permanent, to networks trained with backpropagation. I designed the mechanism and evaluated its consolidation log as an explanation of what the network retains.

  • PyTorch
  • Continual learning
  • Explainability
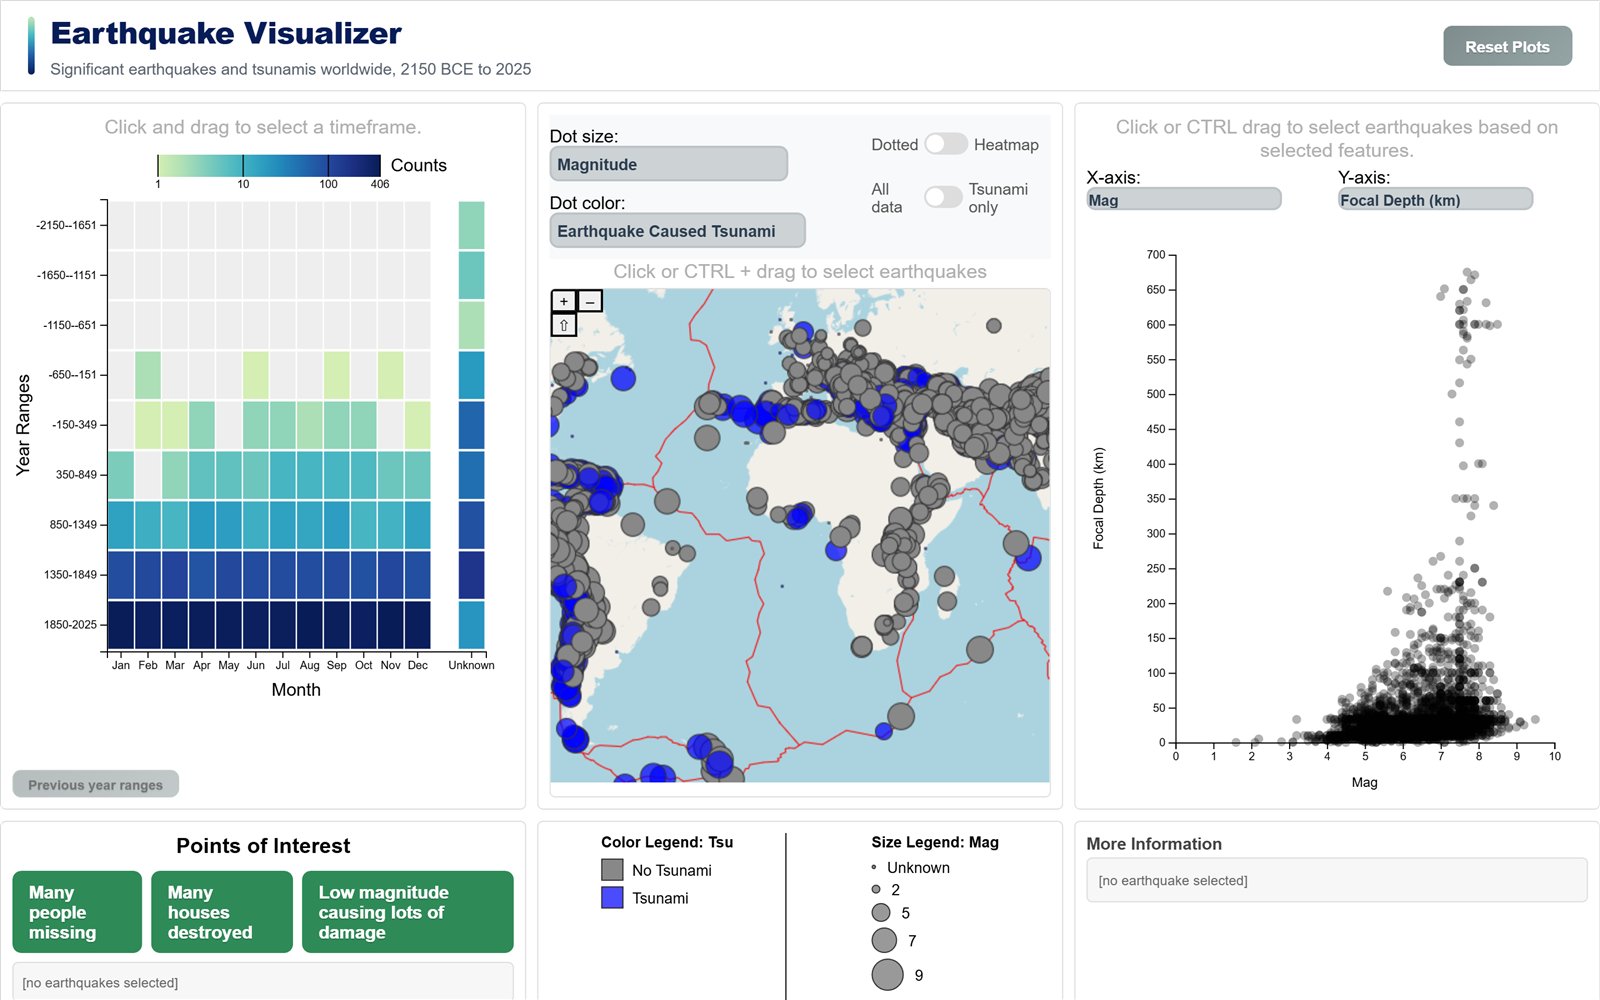
The earthquake visualizer: timeline, world map, scatterplot and detail panels
Data Visualisation · TU Delft

Earthquake visualizer

A group project presenting an interactive visualisation of earthquakes and tsunamis, with a linked map, timeline, scatterplot and detail view in which a selection in one view filters the others. I developed the timeline, a brushable heatmap with drill-down navigation.

  • D3
  • OpenLayers
  • JavaScript
  • Vite
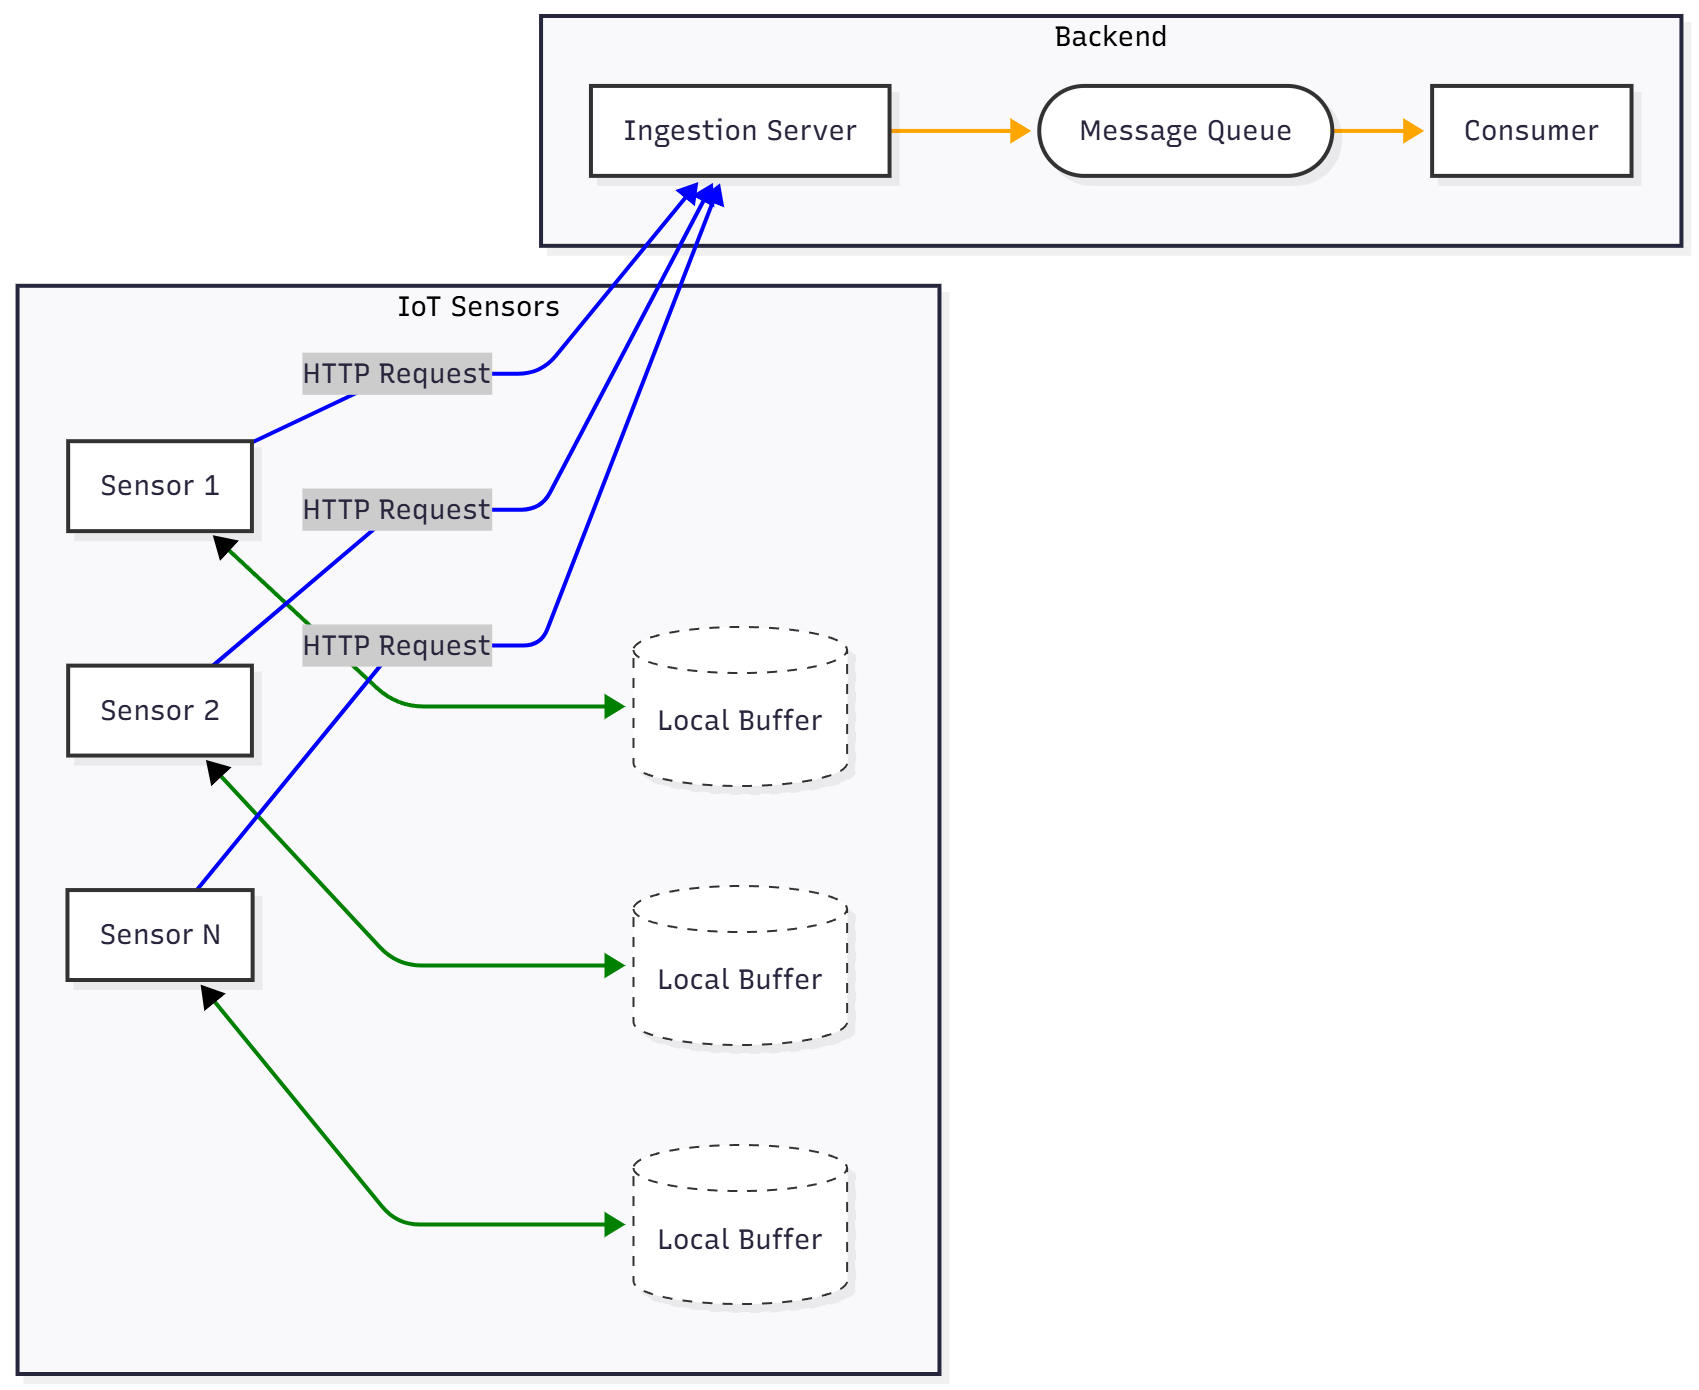
Architecture diagram: sensors with local buffers send HTTP requests to an ingestion server, message queue and consumer
Software Architecture · TU Delft

Fault-tolerant sensor ingestion

A group design of a smart home system that learns household routines, including a proof of concept for loss-free sensor data ingestion during network outages. I developed most of the proof of concept, a FastAPI service and RabbitMQ queue fed by buffering sensors.

  • FastAPI
  • RabbitMQ
  • Docker
  • GitLab CI
  • pytest
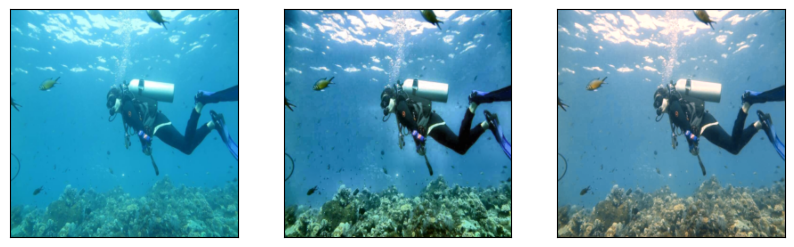
An underwater photo of a diver: raw input, reference and the model's enhanced output
Deep Learning · TU Delft

Deep learning paper reproduction

In a group of four, we reimplemented an underwater image enhancement network from its paper, as no code was publicly available, and reported which results did and did not replicate. I implemented the model architecture in PyTorch and wrote the blog post.

  • PyTorch
  • Computer vision
  • Image enhancement
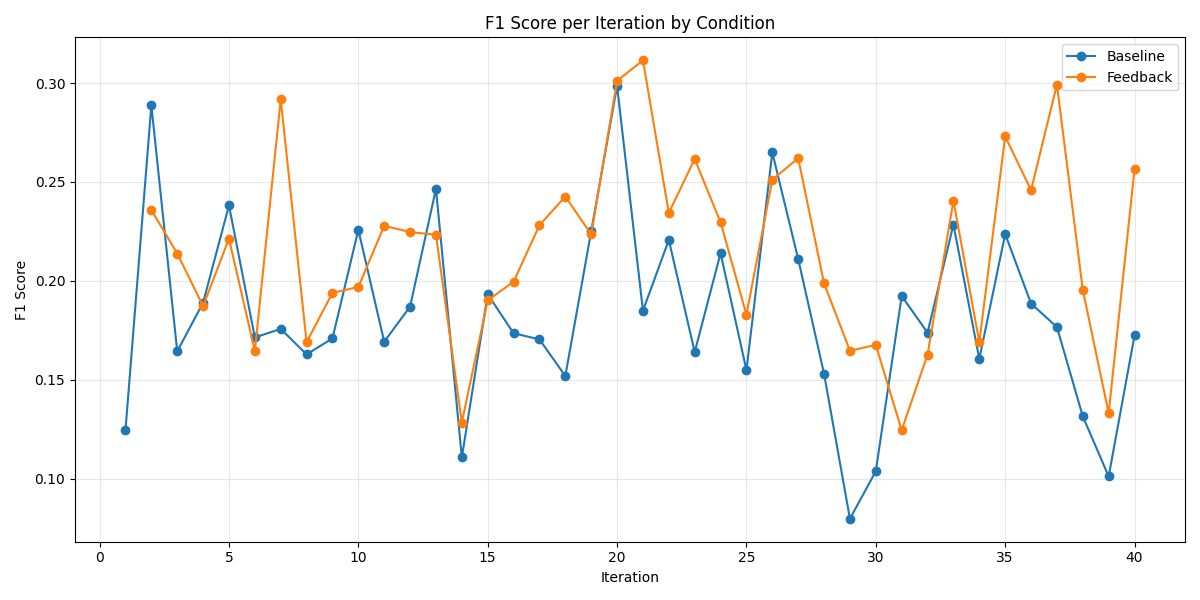
Line chart of agreement F1 per iteration for the baseline and feedback conditions
Group research project · TU Delft

LLM annotation panel

A group study of whether three LLMs labelling meeting transcripts agree more when they see each other's earlier annotations. Agreement rose from 0.185 to 0.216. I implemented the experiment loop that runs the panel and wrote most of the prompts.

  • LLMs
  • Prompting
  • Evaluation
  • Statistics
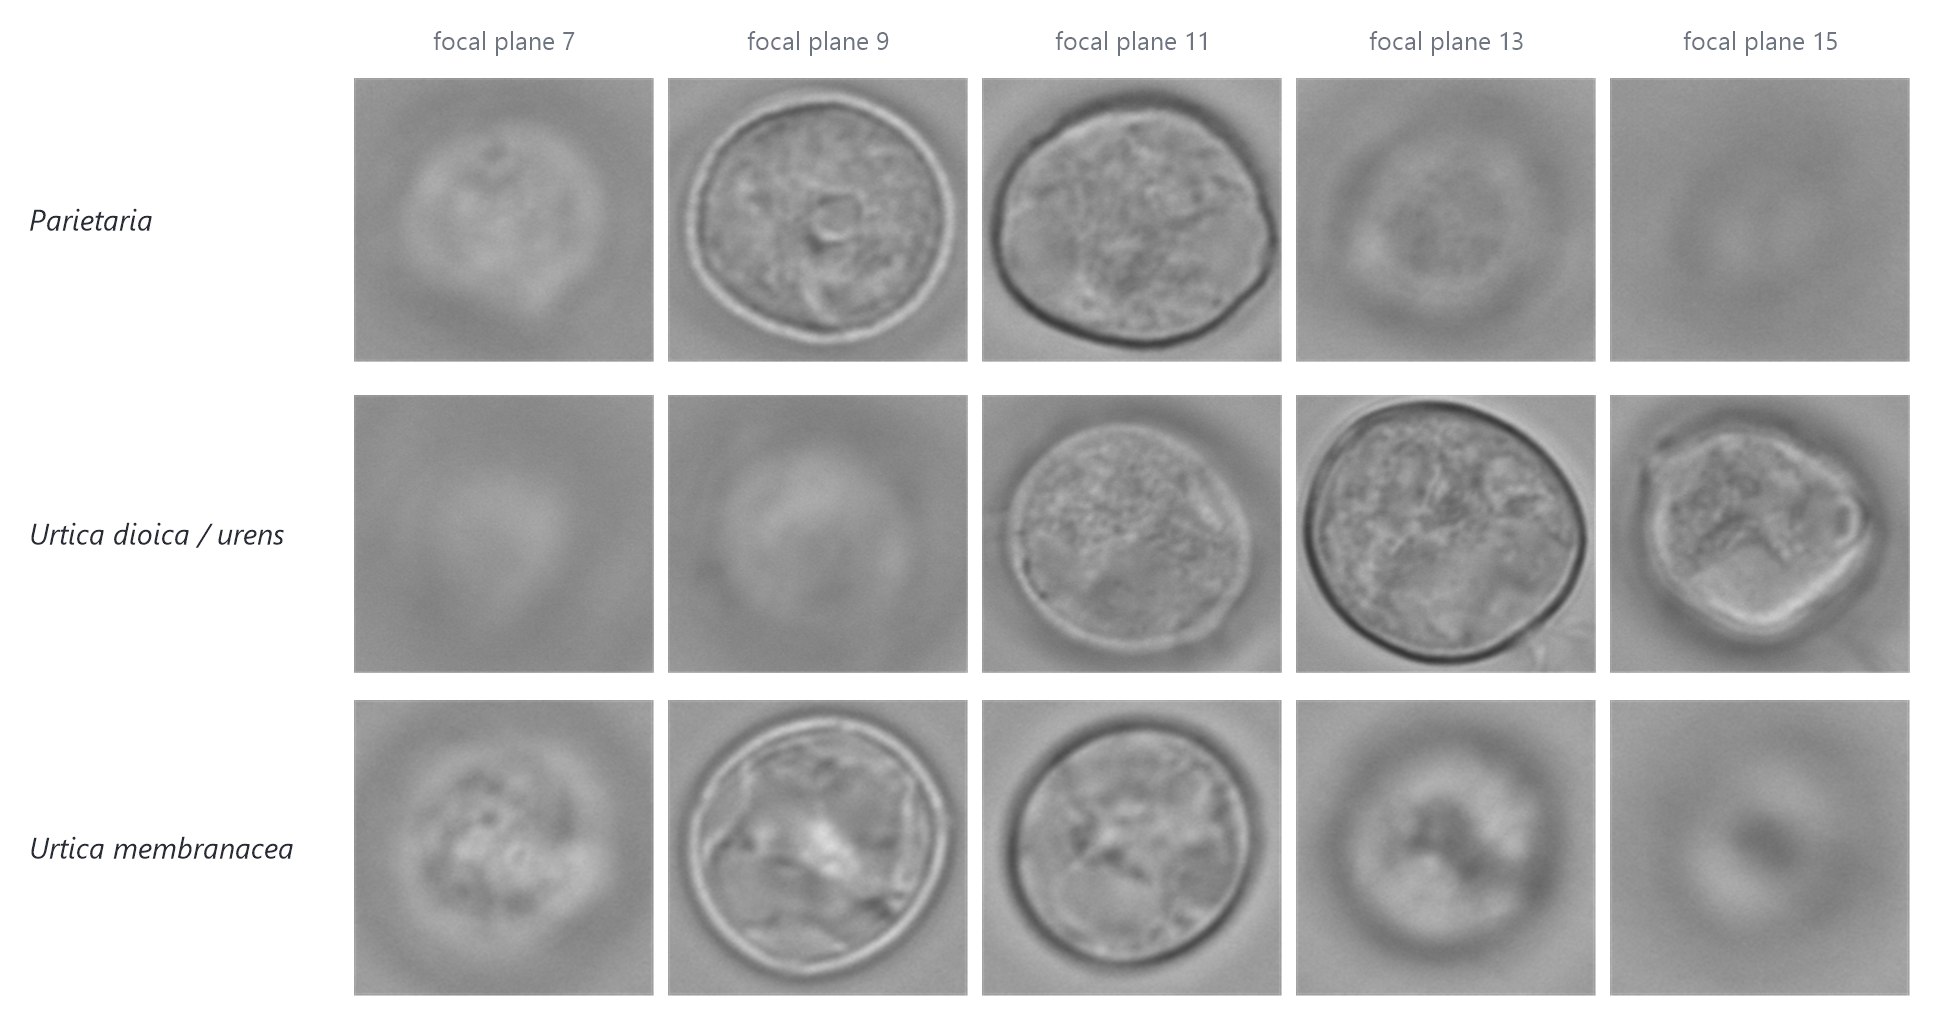
Microscope Z-stacks of one pollen grain from each class, Parietaria, Urtica dioica/urens and Urtica membranacea, at five focal planes
BSc thesis · Leiden University

3D CNNs for pollen classification

Classifies nettle-family pollen from microscope Z-stacks using every focal plane. I trained 3D CNNs in PyTorch, and a ResNet3D trained on the full stack reached 95% test accuracy.

  • PyTorch
  • 3D CNNs
  • Computer vision
  • Bioinformatics
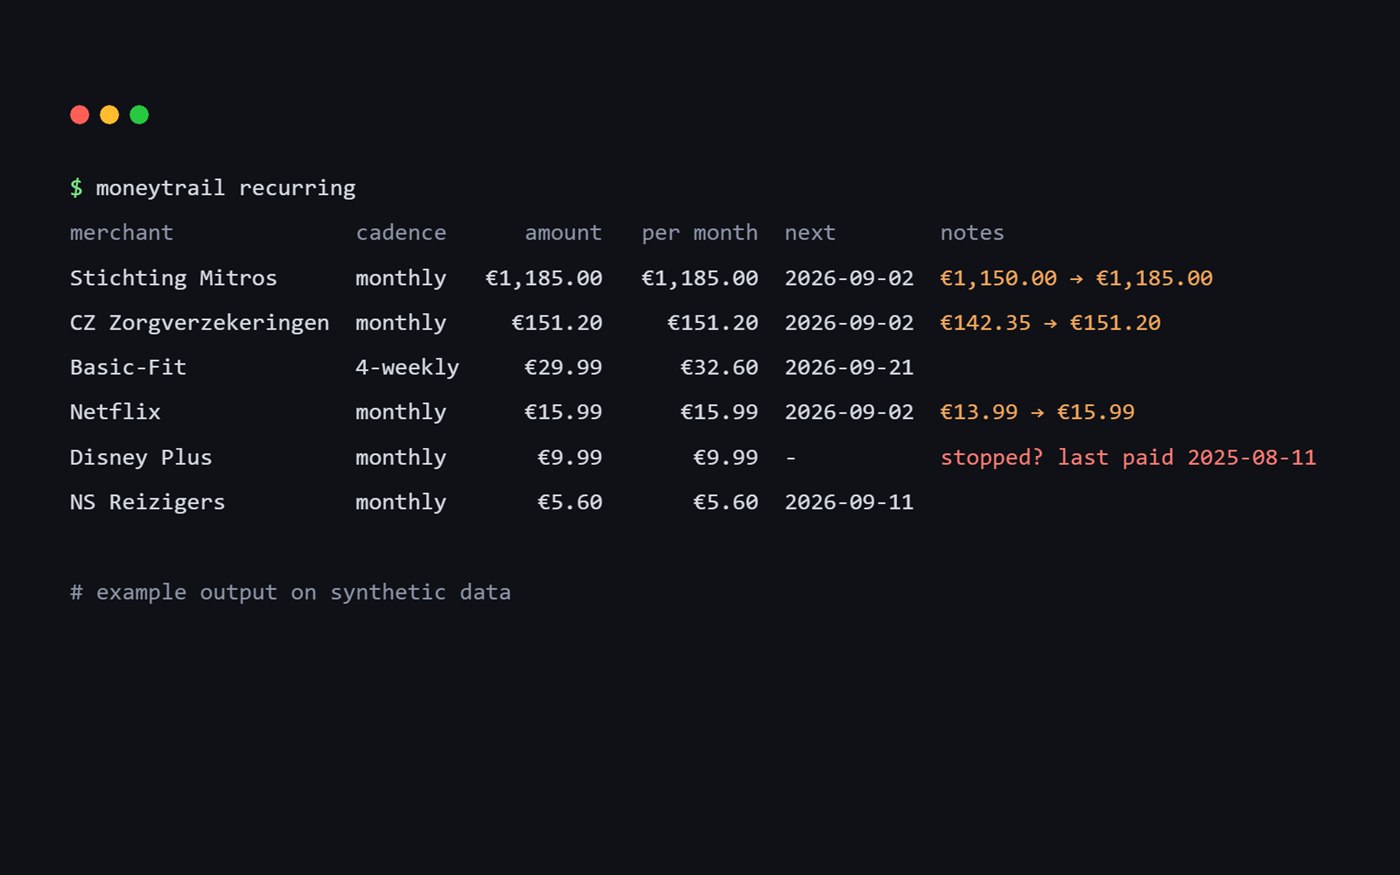
Terminal showing example moneytrail recurring output on synthetic data: merchants, cadence, amounts, price changes and a stopped subscription
Personal project

Moneytrail

Reads Dutch bank CSV exports, identifies the recipient of each payment and detects recurring payments. I developed the merchant matching and recurring-payment detection, which reach a B-cubed F1 of 0.95 on held-out data.

  • Python
  • DuckDB
  • RapidFuzz